Case study, geospatial software
QuickAid
An applicant management system for crisis assistance, with a map that shows which barangays requests come from, never which houses.
- What it is
- Personal project, built with one other contributor
- My part
- Data model, API, geocoding, the map and much of the interface
- Built with
- React 19, Leaflet, TanStack Query and Recharts; Django REST Framework; PostgreSQL
- Where it stands
- Last updated May 2026, with no automated tests yet
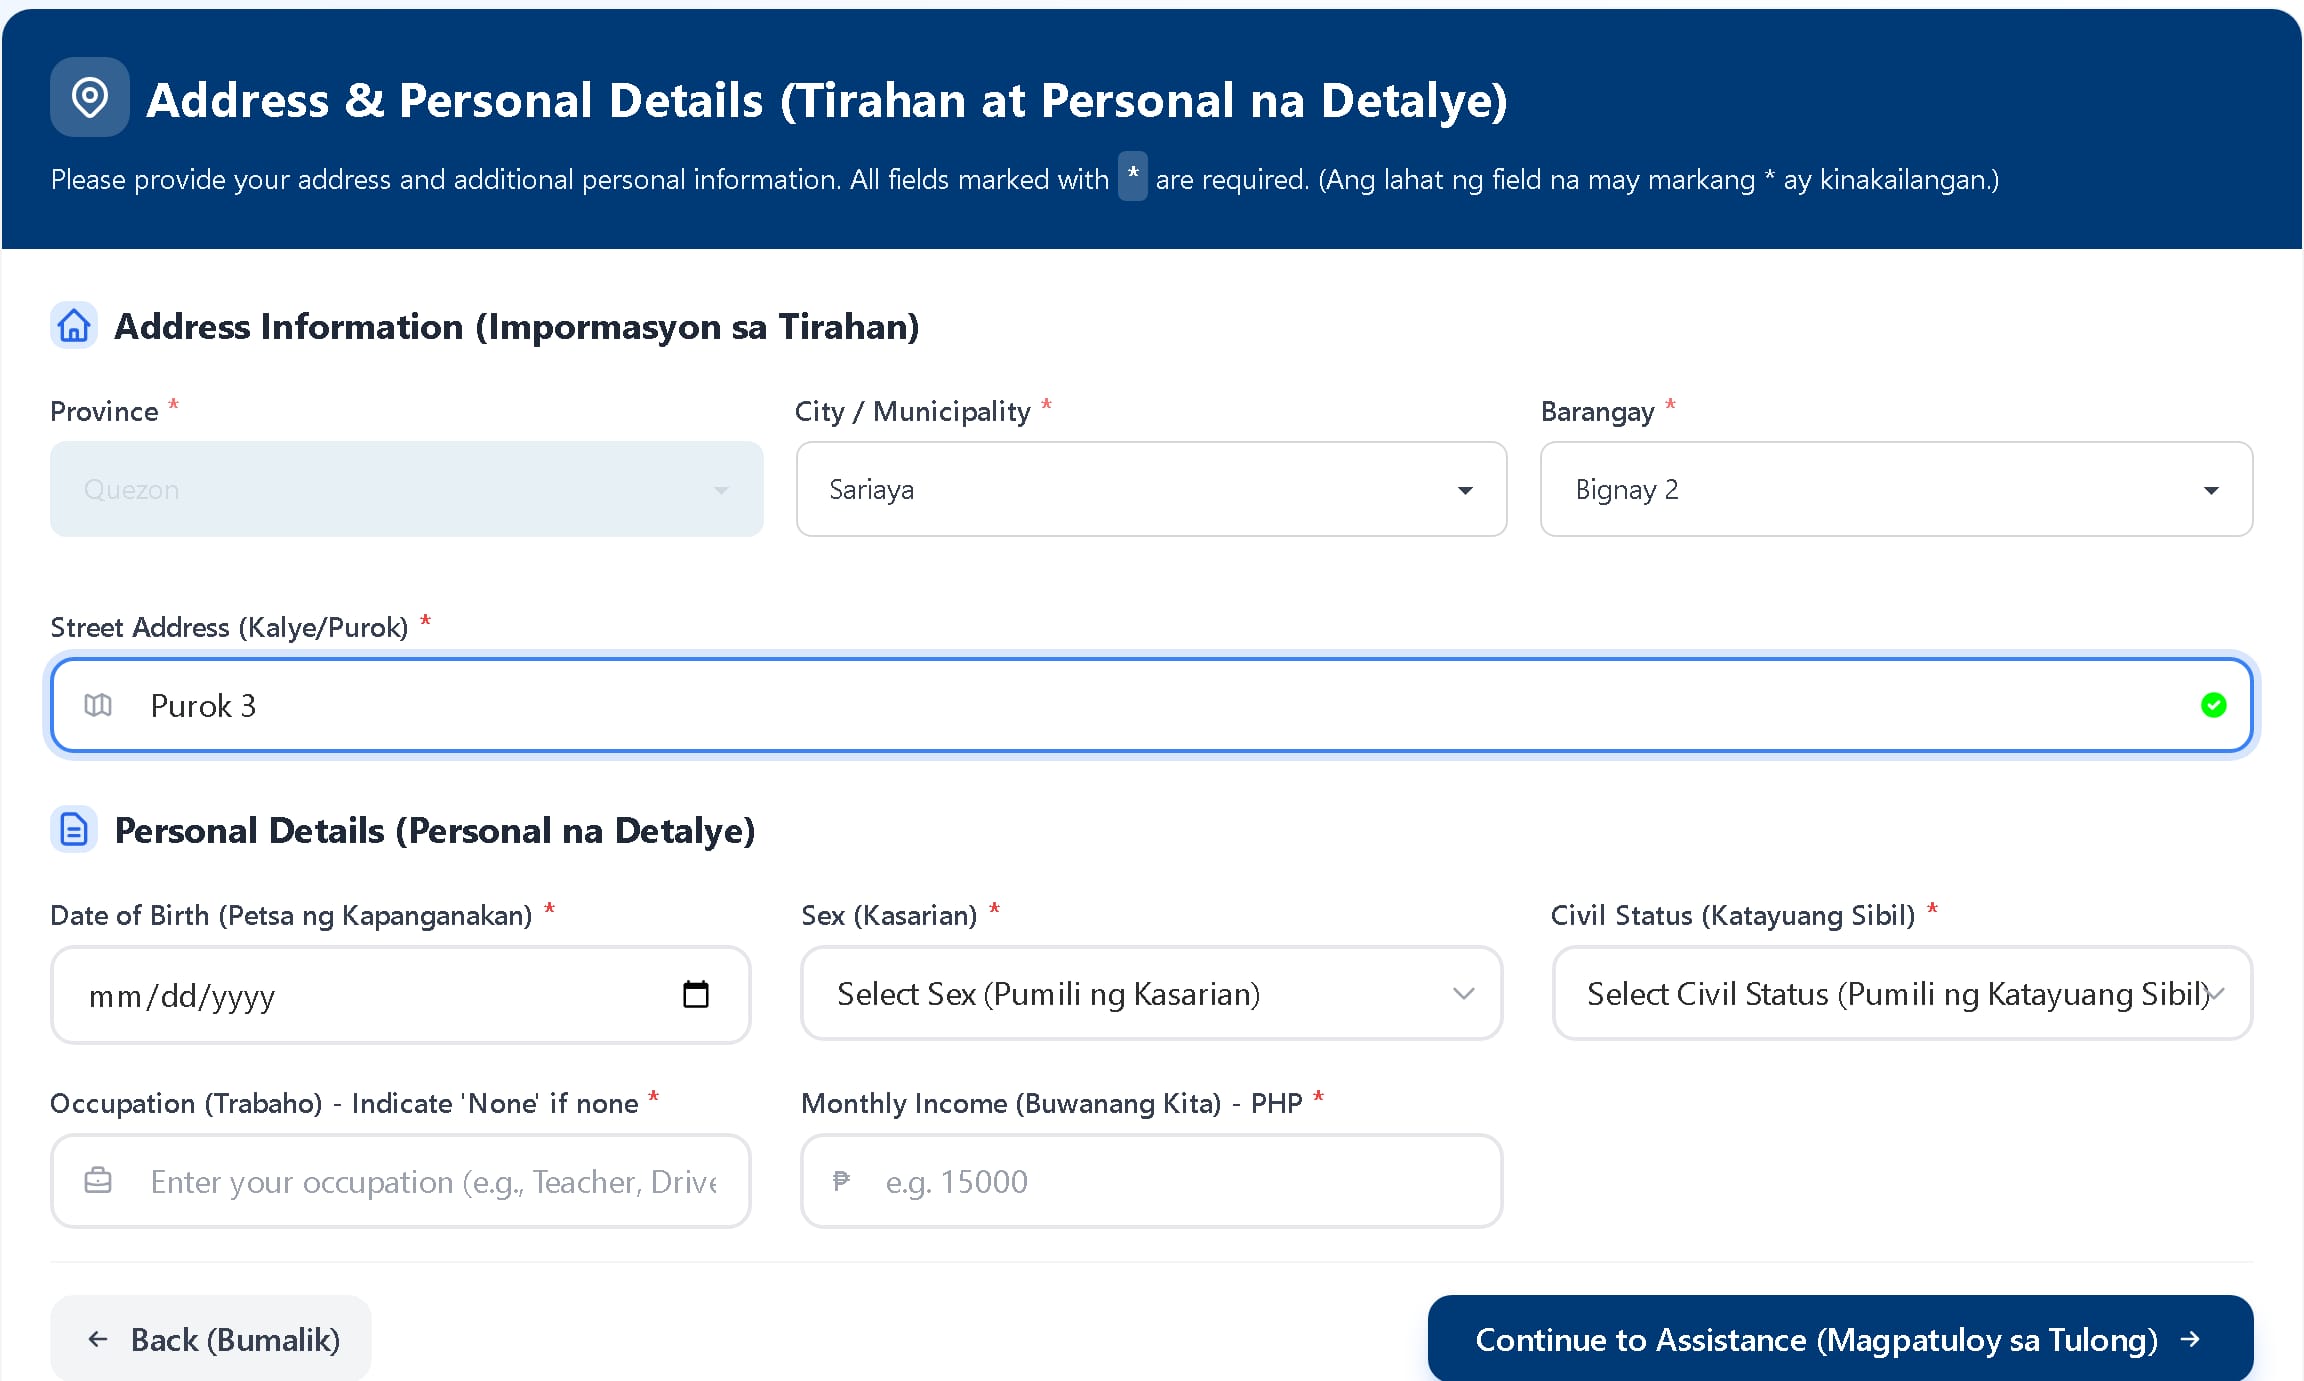
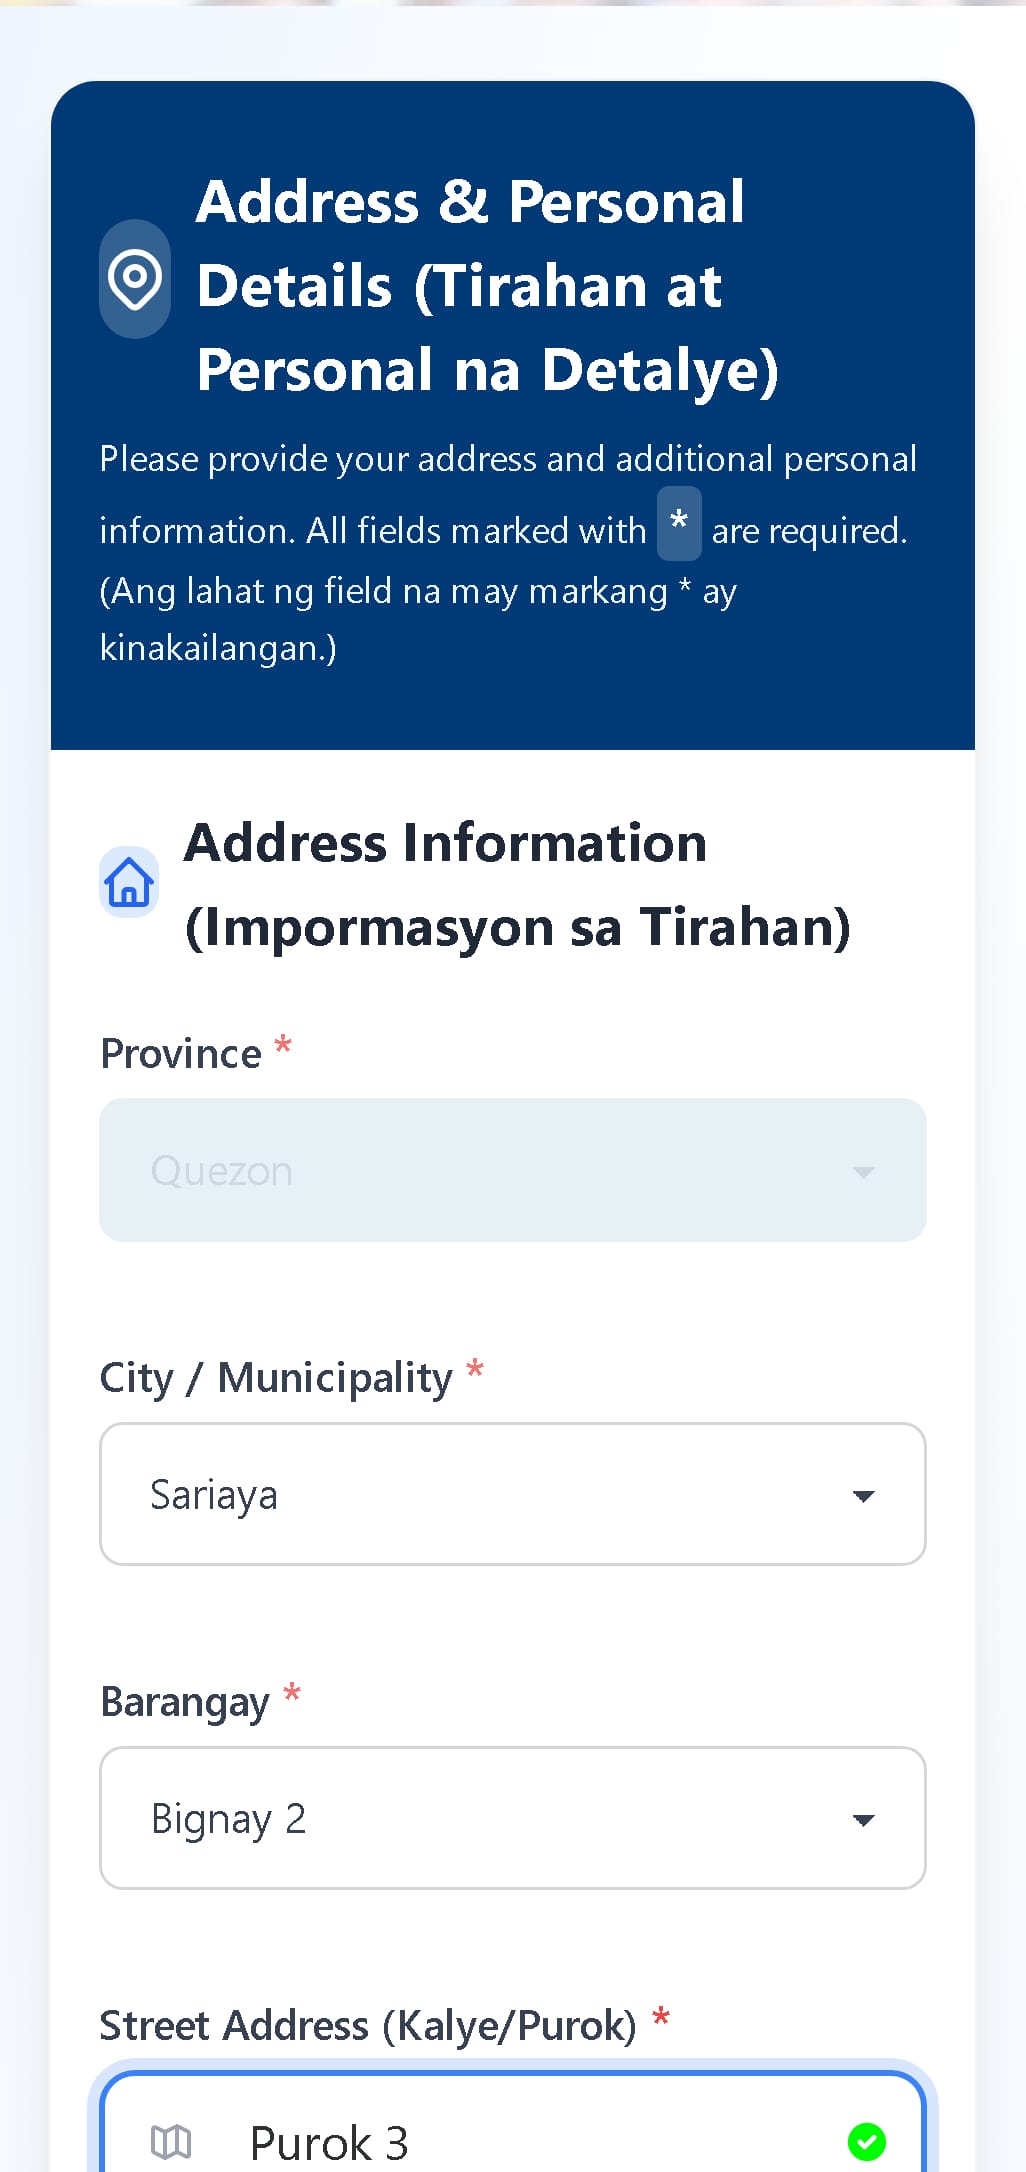
Help is paperwork before it is help
Medical, burial and educational assistance all start with an intake form, then a check for repeat requests, an approved list, a payout and a report. On paper, each of those steps is another copy of the same information, and nobody can see at a glance where the requests are coming from.
QuickAid puts the whole path in one system for the staff who run it, and gives applicants a form they can fill in on their own phone. Because every application carries a place, the same records can be drawn on a map, and that is where most of the engineering went.
From application to payout
- Step 1
Apply
A four-step public form in English and Filipino, or staff registering an applicant in person. Staff can share a QR code, and applications sent through it are credited to them.
- Step 2
Check
Every application belongs to one person record, keyed on name and birthday, so repeat requests line up in one history. A new application is marked suspicious if its phone number was used with a different birthday or name, or by three or more people.
- Step 3
Approve
Staff upload the approved list as a CSV or Excel file. Each upload records how many rows were approved, were already approved or matched no one, and keeps an audit log.
- Step 4
Pay out
Payouts run in batches by type of assistance and payout date, each with a budget and one claim per applicant.
- Step 5
Report
Analytics on geography, demographics and income, trends, staff performance and budget, exported as PDF or Excel. Intake sheets and certificates print from the record.
Where a point on the map comes from
An application’s place on the map is worked out on the server, from its barangay, every time it is saved. The map on the right shows the 168 reference points behind it, across 6 municipalities. Pick one to see how far the random offset can move a point.
The applicant picks a barangay from a list
The form offers only the barangays of six municipalities in Quezon province. The record keeps that barangay’s official code; the street address is stored as text and never looked up.
QuickAid looks up the barangay’s reference point
Each of the barangays was geocoded once, ahead of time, with a small tool that queried the Photon geocoder one request per second, tried three spellings of each place and graded every answer high, medium or low. The results ship with the backend and are cached in memory for a week.
It moves the point a short random distance
Up to 0.001° in each direction, about 110 metres. Applications from the same barangay spread out instead of stacking on one dot, and no marker sits at anyone’s home.
If a barangay is missing, it asks Photon
The live lookup is cached for 30 days and offset up to 0.002°. If that fails too, the application is saved without a location rather than with a wrong one.
Signed-in staff see the map
Up to the 2,000 most recent applications, as clustered markers or a heatmap, over street or satellite tiles, filtered by municipality, barangay and type of assistance.
Bignay 2, Sariaya
- Reference point
- 13.84929° N, 121.46961° E
- Confidence
- High: the geocoder’s answer named both the barangay and the town.
Reference points and barangay names come from the project’s own data file; the eight positions shown for each barangay were produced by running QuickAid’s geocoding function. No applicant data is used.
How it is put together
1. Browser
React 19 single-page app. Leaflet draws the map with marker clusters and a heat layer; Recharts draws the analytics.
2. Vercel
Hosts the public site and the staff app.
3. Django REST API
Applicants, approvals, payouts, analytics, exports and staff accounts, with geocoding in the applicant model.
4. PostgreSQL
Regions, provinces, municipalities and barangays by official code, and every applicant’s history.
Who can reach what
Three endpoints are public: the application form, a contact form and the list of staff behind the QR links. Fifty-six need a signed-in staff account, and seven are for administrators only, such as creating staff accounts. Sign-in uses JSON Web Tokens.
Places as data
Regions, provinces, municipalities and barangays are tables keyed by their official Philippine Standard Geographic Code, imported from a public code list, so the form’s cascading lists and the map’s filters read from the same source.
What is not done yet
- There are no automated tests. The test file in the backend is the empty one Django creates, and the frontend has testing libraries installed but no tests.
- Sign-in tokens are kept in the browser’s local storage, where any script on the page could read them, and the access token lasts ten hours.
- A rate limit for public applications, ten an hour per address, is written but not attached to the form’s endpoint. Exports are limited to five an hour per user.
- Automated geocoding needs a human check: 3 reference points landed about 102 km away and were not flagged. The map above shows them.
- The map endpoint caches its results under one key whatever the filters, so filtering also has to happen in the browser, which it does.
- The staff screens need a login and are not shown. The screenshots are of the public form, with fictional details typed in and nothing submitted.
- QuickAid’s public pages describe the AICS assistance programme and carry the DSWD name and logo. This case study does not claim any affiliation, commission or endorsement, and leaves those pages out.